Deploy Elastic 9 with Elasticsearch, Kibana, Fleet Server and Elastic Agent on Debian
- Last updated: May 15, 2026

In this article, I will show you how to install Elastic, a SIEM (Security Information and Event Management) solution developed by Elastic N.V.. A SIEM is a cybersecurity platform that centralizes and analyzes logs and events collected from multiple devices across a network. It helps security teams detect anomalous activities, investigate incidents, and generate alerts in real time.
We will deploy the core Elastic Stack, including Elasticsearch and Kibana, on a Debian server in an on-premises environment. For basic use, no commercial license is required, as self-managed Elastic deployments can run with the free Basic license. However, for production environments, I recommend that companies evaluate a commercial subscription to benefit from official support and additional features.
I previously published an article covering the installation of Elastic Stack version 8 (available here). With the release of Elastic Stack version 9, I am updating this guide to reflect the current installation process and introduce the modern Fleet-based architecture. In this architecture, Fleet Server acts as the control plane between Kibana Fleet and the Elastic Agents installed on the systems we want to monitor. It manages agent policies, collects agent status information, and coordinates actions across enrolled agents.
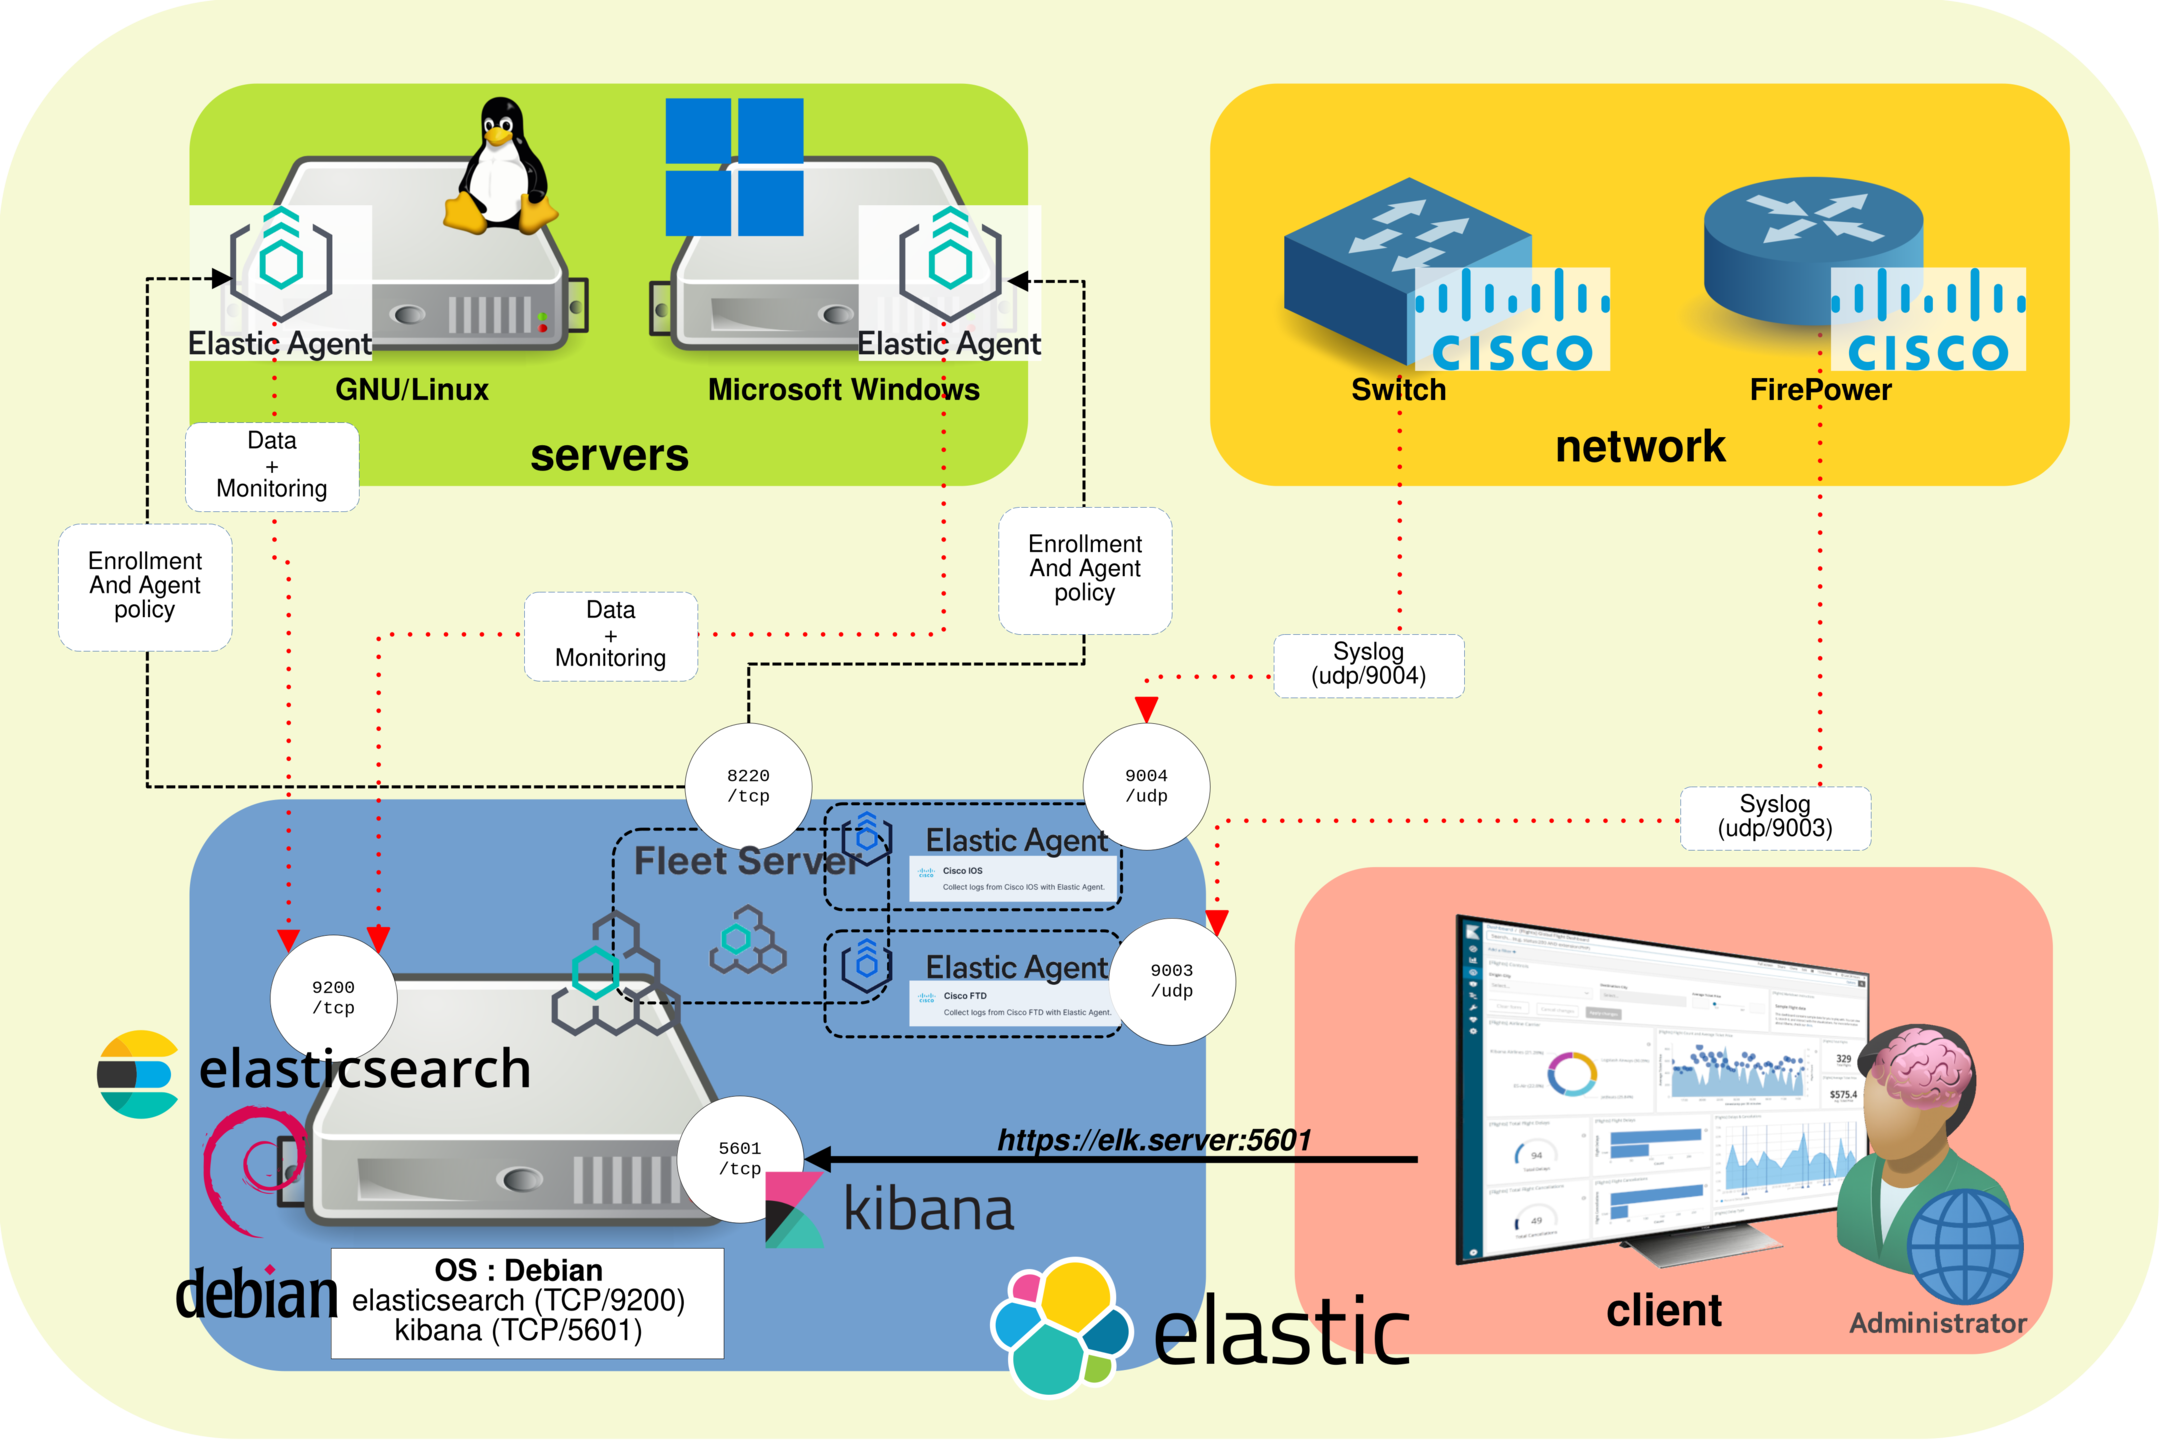
Elastic Stack Architecture
- The Elastic Stack architecture is composed of the following components:
- Elasticsearch: a real-time, distributed storage, search, and analytics engine. It stores the collected data and makes it available for fast searches, correlation, and analysis.
- Kibana: an open source analytics and visualization platform designed to work with Elasticsearch. It provides the web interface used to search, view, and interact with data stored in Elasticsearch indices.
- Fleet: the centralized management interface available in Kibana. It is used to define and manage agent policies, integrations, and configuration settings for monitored systems.
- Fleet Server: the communication layer between Kibana Fleet and the enrolled Elastic Agents. It distributes policies, collects agent status information, and coordinates actions across monitored devices.
- Elastic Agent: the agent installed on the systems we want to monitor. It collects logs, metrics, and security-related events, then sends them to the Elastic Stack according to the policy assigned from Fleet.
Notes
Versions
- OS: Debian 13
- Elastic Stack: 9.x
- Elasticsearch: 9.x
- Kibana: 9.x
- Elastic Agent: 9.x
Links
- Download link: https://www.elastic.co/downloads/
- Elasticsearch Debian package installation guide: https://www.elastic.co/docs/deploy-manage/deploy/self-managed/install-elasticsearch-with-debian-package
- Kibana Debian package installation guide: https://www.elastic.co/docs/deploy-manage/deploy/self-managed/install-kibana-with-debian-package
- Fleet and Elastic Agent documentation: https://www.elastic.co/docs/reference/fleet/
Ports used
- Elasticsearch default HTTPS port:
https://IP_ADDRESS:9200 - Kibana web access:
https://IP_ADDRESS:5601if TLS is enabled - Fleet Server default HTTPS port:
https://IP_ADDRESS:8220
Installing Elastic 9 (Debian Server)
Prerequisites
- Install
apt-transport-httpsand the required packages:
root@host:~# apt update && apt install apt-transport-https gnupg curl wget sudo- Import the Elastic PGP key:
root@host:~# wget -qO - https://artifacts.elastic.co/GPG-KEY-elasticsearch | gpg --dearmor -o /usr/share/keyrings/elasticsearch-keyring.gpg- Add the Elastic 9.x APT repository:
root@host:~# echo "deb [signed-by=/usr/share/keyrings/elasticsearch-keyring.gpg] https://artifacts.elastic.co/packages/9.x/apt stable main" | tee /etc/apt/sources.list.d/elastic-9.x.listElasticsearch
- Install Elasticsearch and save the generated elastic superuser password:
root@host:~# apt update && apt install elasticsearch- At the end of the installation, Elasticsearch displays the security auto-configuration information:
[…]
--------------------------- Security autoconfiguration information ------------------------------

Authentication and authorization are enabled.
TLS for the transport and HTTP layers is enabled and configured.

The generated password for the elastic built-in superuser is : elastic_password;)

If this node should join an existing cluster, you can reconfigure this with
'/usr/share/elasticsearch/bin/elasticsearch-reconfigure-node --enrollment-token <token-here>
after creating an enrollment token on your existing cluster.

You can complete the following actions at any time:

Reset the password of the elastic built-in superuser with
'/usr/share/elasticsearch/bin/elasticsearch-reset-password -u elastic'.

Generate an enrollment token for Kibana instances with
 '/usr/share/elasticsearch/bin/elasticsearch-create-enrollment-token -s kibana'.

Generate an enrollment token for Elasticsearch nodes with
'/usr/share/elasticsearch/bin/elasticsearch-create-enrollment-token -s node'.

-------------------------------------------------------------------------------------------------
### NOT starting on installation, please execute the following statements to configure elasticsearch service to start automatically using systemd
 sudo systemctl daemon-reload
 sudo systemctl enable elasticsearch.service
### You can start elasticsearch service by executing
sudo systemctl start elasticsearch.service- Reload the
systemdmanager configuration:
root@host:~# systemctl daemon-reload- Enable the Elasticsearch service so it starts automatically at boot:
root@host:~# systemctl enable elasticsearch.service- Start the Elasticsearch service:
root@host:~# systemctl start elasticsearch.serviceKibana
- Install Kibana:
root@host:~# apt update && apt install kibanaConfiguring
Elasticsearch
- Edit
/etc/elasticsearch/elasticsearch.ymland configure the network bind address:
network.host: 0.0.0.0- Restart the Elasticsearch service:
root@host:~# systemctl restart elasticsearch.service- Check that Elasticsearch is running and responding over HTTPS:
root@host:~# curl --cacert /etc/elasticsearch/certs/http_ca.crt -u elastic https://localhost:9200
Enter host password for user 'elastic': elastic_password;)
{
  "name" : "std",
  "cluster_name" : "elasticsearch",
  "cluster_uuid" : "StdgreaTBanDKphU4S0ceg",
  "version" : {
    "number" : "9.4.1",
    "build_flavor" : "default",
    "build_type" : "deb",
    "build_hash" : "3c7c6027c5769d860d87448e2749f4c550a239da",
    "build_date" : "2026-05-08T10:08:29.383338563Z",
    "build_snapshot" : false,
    "lucene_version" : "10.4.0",
    "minimum_wire_compatibility_version" : "8.19.0",
    "minimum_index_compatibility_version" : "8.0.0"
  },
  "tagline" : "You Know, for Search"
}
Kibana
- Edit
/etc/kibana/kibana.ymland configure the network bind address. In this lab, Kibana listens on all network interfaces. HTTPS will be enabled later in this guide:
server.host: "0.0.0.0"
server.publicBaseUrl: "http://X.X.X.X:5601"- Start Kibana:
root@host:~# systemctl start kibana.service- Create a Kibana enrollment token from the Elasticsearch server:
root@host:~# /usr/share/elasticsearch/bin/elasticsearch-create-enrollment-token -s kibana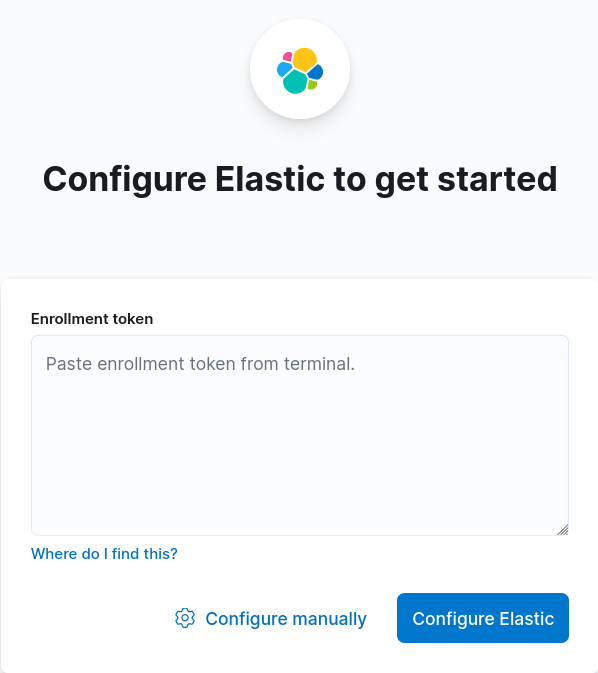
eyJ2ZXIiOiI4LjEuMiIsImFkciI6WyIxOTIuMTY4LjEuNjY6OTIwMCJdLCJmZ3IiOiJmYzdiZmFmMjNmODEzN2M1NmY4YTg1NGMxNTdjMWFkYTNiZDdiOGM4NTE4YTZhNmI3wWNiYzBkNzc0ZTRjNzc1Iiwia2V5Ijoib1ZBTkVJQUIxWVNBT0BiUWVsUVc6cEU1WXF3U1FTUENjcFFaZUJvTGtKdyJ0- From Firefox, open
http://X.X.X.X:5601, paste the enrollment token, and click Configure Elastic:
- Generate the Kibana verification code and paste it into the setup page:
root@host:~# /usr/share/kibana/bin/kibana-verification-code
Your verification code is:  139 477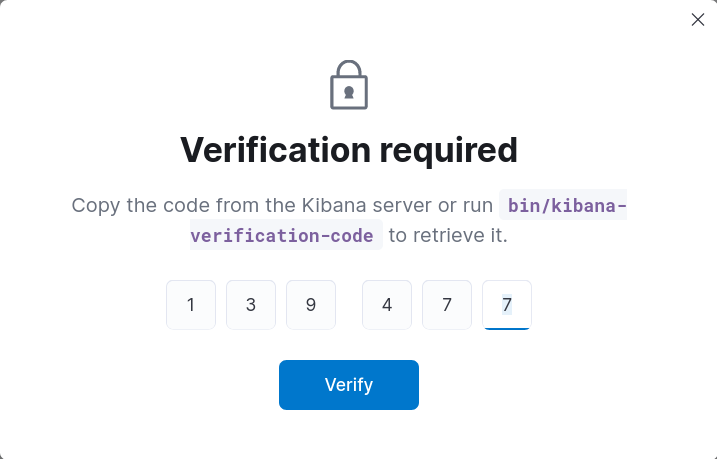
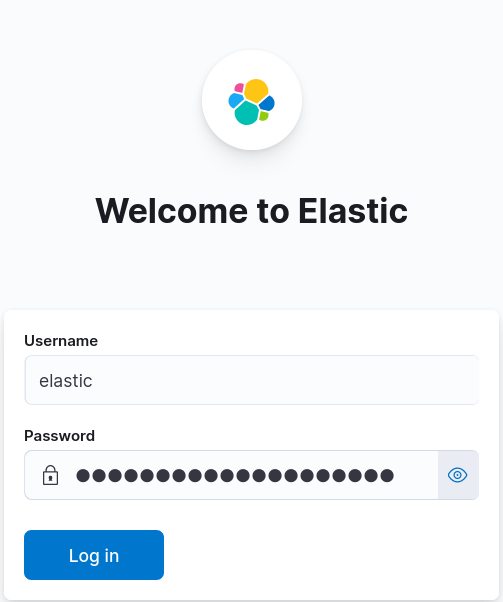
- You can now log in to Kibana with the elastic built-in superuser account:
Securing Kibana
Since version 8, Elasticsearch automatically enables security features during installation, including authentication and TLS encryption for both the HTTP and transport layers.
However, Kibana is still accessed over HTTP by default. In this section, we will enable HTTPS for the Kibana web interface.
- Run the
kibana-encryption-keysscript and copy the generated values:
root@host:~# /usr/share/kibana/bin/kibana-encryption-keys generate
## Kibana Encryption Key Generation Utility

The 'generate' command guides you through the process of setting encryption keys for:

xpack.encryptedSavedObjects.encryptionKey
    Used to encrypt stored objects such as dashboards and visualizations
    https://www.elastic.co/guide/en/kibana/current/xpack-security-secure-saved-objects.html#xpack-security-secure-saved-objects

xpack.reporting.encryptionKey
    Used to encrypt saved reports
    https://www.elastic.co/guide/en/kibana/current/reporting-settings-kb.html#general-reporting-settings

xpack.security.encryptionKey
    Used to encrypt session information
    https://www.elastic.co/guide/en/kibana/current/security-settings-kb.html#security-session-and-cookie-settings


Already defined settings are ignored and can be regenerated using the --force flag.  Check the documentation links for instructions on how to rotate encryption keys.
Definitions should be set in the kibana.yml used configure Kibana.

Settings:
xpack.encryptedSavedObjects.encryptionKey: caeb7879368e3dd66d7302f6810daec1
xpack.reporting.encryptionKey: c1c89f500966ac710f7fa5eaf2939976
xpack.security.encryptionKey: e1458d710ffb321e4a4f4eb792c78b2b- Add the previously generated encryption keys to
/etc/kibana/kibana.yml:
[…]
xpack.encryptedSavedObjects.encryptionKey: caeb7879368e3dd66d7302f6810daec1
xpack.reporting.encryptionKey: c1c89f500966ac710f7fa5eaf2939976
xpack.security.encryptionKey: e1458d710ffb321e4a4f4eb792c78b2b- Retrieve the secure password of the
http.p12keystore:
root@host:~# /usr/share/elasticsearch/bin/elasticsearch-keystore show xpack.security.http.ssl.keystore.secure_password
592l_UJGSXmliJIvuokDab- Go to the
/etc/kibana/directory:
root@host:~# cd /etc/kibana/- Extract the TLS certificate from the Elasticsearch
http.p12keystore:
root@host:~# openssl pkcs12 -in /etc/elasticsearch/certs/http.p12 -out server.crt -clcerts -nokeys
Enter Import Password:592l_UJGSXmliJIvuokDab- Extract the TLS private key from the same keystore:
root@host:~# openssl pkcs12 -in /etc/elasticsearch/certs/http.p12 -out server.key -nocerts -nodes
Enter Import Password:592l_UJGSXmliJIvuokDab- Set the file owner to
rootand the group tokibana:
root@host:~# chown root:kibana /etc/kibana/server.*- Allow the
kibanagroup to read the certificate and private key files:
root@host:~# chmod g+r /etc/kibana/server.*- Edit
/etc/kibana/kibana.ymlto enable HTTPS for the Kibana web interface:
server.ssl.enabled: true
server.ssl.certificate: /etc/kibana/server.crt
server.ssl.key: /etc/kibana/server.key- Restart the Kibana service:
root@host:~# systemctl restart kibana.serviceWait a few seconds, then connect to Kibana at https://X.X.X.X:5601.
Autostart
Elasticsearch
- Enable the Elasticsearch service:
root@host:~# systemctl enable elasticsearch.serviceKibana
- Enable the Kibana service:
root@host:~# systemctl enable kibana.serviceFleet Server
Now that Elasticsearch and Kibana are running, we can install Fleet Server. As explained earlier, Fleet Server acts as the communication layer between Kibana Fleet and the enrolled Elastic Agents. It is used to manage agent policies, distribute configuration updates, and collect agent status information.
- Open the main menu, then go to Management → Fleet:

- Click Add Fleet Server to start the Fleet Server setup wizard:

- Complete the Fleet Server setup:
- Enter a name for the Fleet Server and specify the URL that enrolled agents will use to reach it. In this lab, because all components are installed on the same server, this URL points to the IP address of the Elastic Stack server.
- Select the Linux x86_64 platform and copy the autogenerated installation commands.
- Run the generated commands from a
rootshell on the server that will host Fleet Server. - After a few moments, Kibana should detect the new Fleet Server. Click Continue enrolling Elastic Agent, then click Close.

- Below is an example of the installation command generated by the Kibana web interface. Type
Ywhen prompted to continue the installation:
root@host:~# curl -L -O https://artifacts.elastic.co/downloads/beats/elastic-agent/elastic-agent-9.4.1-linux-x86_64.tar.gz
tar xzvf elastic-agent-9.4.1-linux-x86_64.tar.gz
cd elastic-agent-9.4.1-linux-x86_64
sudo ./elastic-agent install \
  --fleet-server-es=https://192.168.1.10:9200 \
  --fleet-server-service-token=ABCAAWVsYXN0aWMvZmalZXQtc2VydmVyL5Rva2VuLDEADbEE5RocKSQ3MjM6SGxBajNhSkJSNEdHZ25jOHZNM3ZYUQ \
  --fleet-server-policy=fleet-server-policy \
  --fleet-server-es-ca-trusted-fingerprint=deadbee540c353325d0085a67e1bb2a8ced823f9ae84107b087352754a9a7753 \
  --fleet-server-port=8220 \
  --install-servers
[…]
Elastic Agent will be installed at /opt/Elastic/Agent and will run as a service. Do you want to continue? [Y/n]:Y
[…]
Elastic Agent has been successfully installed.
You now have a working Fleet Server ready to manage enrolled Elastic Agents.
View Logs
Elasticsearch
- Display logs from the
elasticsearch.logfile:
root@host:~# tail /var/log/elasticsearch/elasticsearch.log- Or use the
journalctlcommand:
root@host:~# journalctl --unit elasticsearchKibana
- Display logs from the
kibana.logfile:
root@host:~# tail /var/log/kibana/kibana.log- Or use the
journalctlcommand:
root@host:~# journalctl --unit kibanaWe now have a working Elastic deployment with Elasticsearch, Kibana, and Fleet Server. The next step is to enroll Elastic Agents on the systems we want to monitor so they can forward logs, metrics, and security events for centralized analysis.